 Problem I. 401. (April 2016)
I. 401. (É). Besides weather forecast, meteorological offices often monitor pollen levels. A pollen report contains a 4-level scale of + symbols describing the danger level for the most important allergens or fungal spores. The allergenicity, that is, the frequency of symptoms, is also measured by using the same 4-level scale of + symbols.
The file meres.txt (downloadable from our website) contains the average pollen levels of a given week. In your solution try and use formulae and references; auxiliary computations should be performed on a different sheet, and do not use user-defined functions or macros.
1. Open the tab-separated and UTF-8-encoded data file meres.txt in the spreadsheet application such that the first data piece appears in cell A1. Rename the sheet to Mérés, then save it with name i401 in the default file format of the application.
2. The structure of the table and the cell format should be adjusted according to the description and example.
\(\displaystyle a)\) Use 7- and 10-point Arial fonts on the sheet.
\(\displaystyle b)\) Cells should be aligned according to the example.
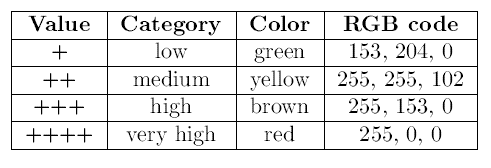
\(\displaystyle c)\) The background of the data cells should depend on the danger level, that is, on the number of + symbols.
\(\displaystyle d)\) In the data cell range, inner cells should be bordered by single thin lines, and the outermost cells by a double cell border.
3. Below the data cells, display for each city the weekly pollen levels of the various allergens by using stacked column charts. The diagram title and structure should be based on the example.
4. Create a new sheet Információ according to the sample. Cell texts, with the exception of the second row, should be typed as in the example.
5. By using a function in the third and fourth cells, determine the allergenicity and the symptoms based on the city name and allergen name in the first two cells of the second row, and on the actual values of the sheet Mérés.
6. The sheet format should be set according to the example.
\(\displaystyle a)\) The font size and style should follow those on the sheet Mérés.
\(\displaystyle b)\) Also copy the cell grouping and alignment.
\(\displaystyle c)\) The first two cells of the second row should have a gray background, and the third and fourth cells should contain boldface fonts.
\(\displaystyle d)\) The cell background colors of the table of danger levels should follow the colors given for the sheet Mérés.
The sheet containing your solution and its short documentation should be submitted in a compressed file i401.zip.
Downloadable file: meres.txt
(10 pont)
Deadline expired on May 10, 2016.
Statistics:
10 students sent a solution. 10 points: Hamrik Szabin, Kelkó Balázs, Kovács 246 Benedek, Nagy Ábel, Olexó Gergely, Radnai Bálint. 9 points: Kis Lázár Bence, Rittgasszer Ákos, Szakali Benedek, Szemerédi Levente.
Problems in Information Technology of KöMaL, April 2016