 Problem I. 257. (January 2011)
I. 257. The management of a certain store analyses shopping habits. Above the ground floor, the store has two floors and one staircase with two escalators, connecting the floors by going upstairs and downstairs. Surveillance cameras observe people entering and exiting the ground floor, and going upstairs and downstairs. Results are summarized quarter-hourly, from the morning opening until the evening closing, that is, between 8:00 and 20:00.
The text file szamlalas.txt (tabulator separated file in UTF-8 encoding, downloadable from our web page) contains the total number of customers in each quarter hour, collected by the six cameras. (In the example, ``0be'' and ``0ki'' abbreviate the number of customers entering and exiting the ground floor, ``1fel'' and ``1le'' stand for the number of people going up to the first floor and coming down from the first floor, ``2fel'' and ``2le'' denote similar numbers for the second floor.)
During your solution you should
-- use formulae, functions or links,
-- place auxiliary computations (if any) to the right of column R.
1. Open the file szamlalas.txt such that its first data piece is put into cell A1. The sheet should be saved as i257 in the default format of the spreadsheet application.
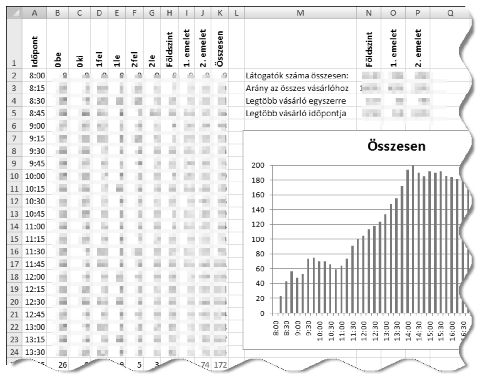
2. You should generate the appropriate time intervals from the opening until closing according to the example (see column ``Időpont'').
3. Cells in columns H, I, J and K should contain the number of customers at the end of the actual interval on each floor: column H for the ground floor (``Földszint'' in the example), I and J for the first and second floors (``1. emelet'', ``2. emelet'') and K for the complete store (``Összesen'').
4. According to the above data, you should answer the following questions.
a. Cells N2:P2 (``Látogatók száma összesen'') should contain the total number of customers that visited each floor during the whole day.b. Cells N3:P3 (``Arány az összes vásárlóhoz'') should contain the relative percentages on each floor (100% corresponds to the total number of customers in the store), using a cell format with zero decimal digits.
c. Cells N4:P4 (``Legtöbb vásárló egyszerre'') should count the maximum number of people present simultaneously on each floor.
d. Cells N5:P5 (``Legtöbb vásárló időpontja'') should display the time interval during which the most people were present simultaneously on each floor.
5. Computed values should appear in blue color.
6. Cells in the first row should be formatted according to the example. Appropriate column widths should be set so that all data is visible.
7. Create a bar chart on the sheet showing the total number of people in the store in each quarter hour, but
-- the chart should not have a legend,
-- its title should be ``Summary''
-- and every second quarter hour should be visible on the horizontal axis.

Your spreadsheet (i257.xls, i257.ods, ...) together with a short documentation (i257.txt, i257.pdf, ...) -- also describing the name and version number of the spreadsheet application -- should be submitted.
(10 pont)
Deadline expired on February 10, 2011.
Sorry, the solution is available only in Hungarian. Google translation
Mintamegoldás
Leitereg András (Budapest, Veres Péter Gimnázium 10. osztály) megoldását közöljük: i257.xls
Statistics:
9 students sent a solution. 10 points: Barta 111 János, Gema Barnabás, Leitereg András, Nánási József, Seres Márk Dániel, Szabó 928 Attila. 9 points: Kalló Kristóf. 8 points: 1 student. 6 points: 1 student.
Problems in Information Technology of KöMaL, January 2011
