 Problem I. 296. (May 2012)
I. 296. Environmental protection is emphasized more and more in our daily lives. Nowadays weather forecasts usually include some data on air pollution as well. Budapest has 11 different locations to monitor air quality and various pollutant concentrations. In this exercise you are going to work with the data collected during the first two months of 2012 by the Hungarian Air Quality Network, http://www.kvvm.hu/olm.
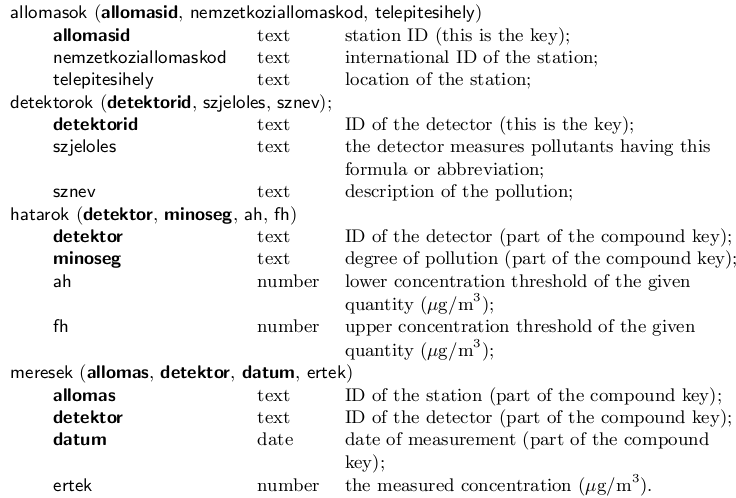
[1.] Create an empty database with name i296. Import data into this database from the text files allomasok, detektorok, hatarok and meresek, downloadable from our web page. (Table names in the database should be the same as the corresponding file names. The first lines of these UTF-8 encoded, tabulator separated files contain the field identifiers.) The relation between the tables is described by the figure. The ertek field of the file meresek is empty if the given detector on the given day did not yield any measurement.
Tables:
[2.] Create a query to determine which pollutants were not measured by the stations on January 18, 2012. The query should show the fields telepitesihely and sznev. (2jan18hiba)
[3.] Make a query to list for each station the pollutants without any collected data during the 60 days. The query should show the fields telepitesihely and sznev. (3vegiguzemenkivul)
[4.] Make a parametric query to list data for stations with detectors measuring the pollutants corresponding to szjeloles. (4holmerheto)
[5.] Determine by a query the average value and the quality range of ``nagyszemcsés szálló por koncentráció'' (concentration of large-particle floating dust) in January. (5janporminoseg)
[6.] List the station names and dates for each pollutant with maximal concentration during the first 2 months of the year. The list should be sorted according to date. (6maximumok)
[7.] Describe the effect of the increased traffic during working days on air pollution. Create a query to determine the average values of nitrogen oxides (NO, NO2, NOx) and sulphur dioxide (SO2) during working days and over the weekend, moreover, calculate the percentage of the weekend average versus the workday average. (7kozlekedesihatas)
[8.] For each station, determine the ratio between the maximal and minimal concentration of each pollutant. The 10 pollutants with highest ratio should be displayed together with fields telepitesihely, sznev and the actual ratio. (8nagyvaltozas)
Your database (i296.mdb, i296.accdb, i296.odb, ...) together with a short documentation (i296.txt, i296.pdf, ...) - also describing the name and version number of the database application - should be submitted in a compressed file i296.zip.
Downloadable files: allomasok.txt, detektorok.txt, hatarok.txt, meresek.txt.
(10 pont)
Deadline expired on June 11, 2012.
Sorry, the solution is available only in Hungarian. Google translation
A programozáshoz hasonlóan - célszerű itt is lépésenként megközelíteni egy-egy bonyolultabb kérdésre a választ. Ügyes segédlekérdezésekkel lehet igazán hatékonyan megalkotni a végső lekérdezéseket. Álljon erre példaként Gema Barnabás, a veszprémi Lovassy László Gimnázium tanulójának kicsit javított megoldása. i296.accdb
Statistics:
5 students sent a solution. 10 points: Gema Barnabás. 9 points: Antal János Benjamin, Kocsis 789 Mátyás. 5 points: 1 student. 3 points: 1 student.
Problems in Information Technology of KöMaL, May 2012