 Problem I. 330. (October 2013)
I. 330. Infographics are combination of images, figures and text, but an infographic is more complex than a simple image or figure, and conveys more information than a piece of text.
The aim of infographics is to present information in a concise and clear way. The following link for example contains several nicely designed and attractive infographics: http://www.1stwebdesigner.com/inspiration/beautiful-infographics/.
Besides various education regulations, the local pedagogical program of a school describes, among others, the number of lessons for each subject and each class.
Your task is to visualize the pedagogical program describing the educational system of a school by using an infographic. You can omit some details of the pedagogical program, for example, you may focus only on a specific class type, or on a specific grade, or you can highlight subjects with extra hours beyond regular curriculum - it is your decision which aspects to emphasize on a visually appealing infographic.
The final infographic together with a short documentation (i330.txt, i330.pdf, ...) - also containing the software tools used and the URL of the pedagogical program of your school - should be submitted in a compressed file (i330.zip).
(10 pont)
Deadline expired on November 11, 2013.
Sorry, the solution is available only in Hungarian. Google translation
Infografikát készíteni nem könnyű. Jó infografikát készíteni pedig egyenesen nehéz. Azt tapasztaltuk, hogy célszoftver alkalmazása nélkül nem is sikerült igazán jól megoldani a feladatot.
Lényeges, hogy többféle eszközzel dolgozzunk, képpel, szöveggel, számadatokkal, ezek egymást erősítsék. Tehát nem egyszerűen egy diagramot vagy egy prentáció néhány diáját jelenítjük meg. A kép területét lehetőleg arányosan és hatékonyan használjuk ki.
A következő szempontok alapján történt az értékelés: i330ertekeles.pdf
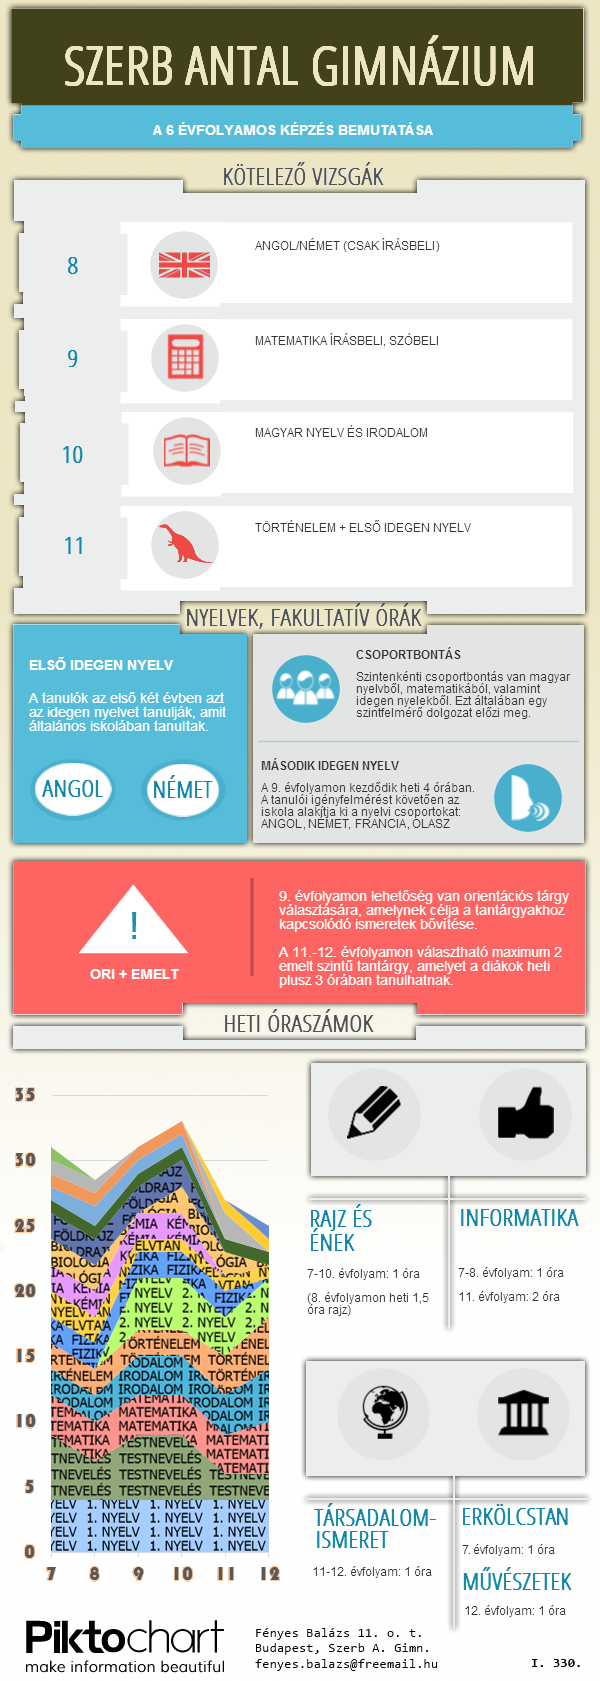
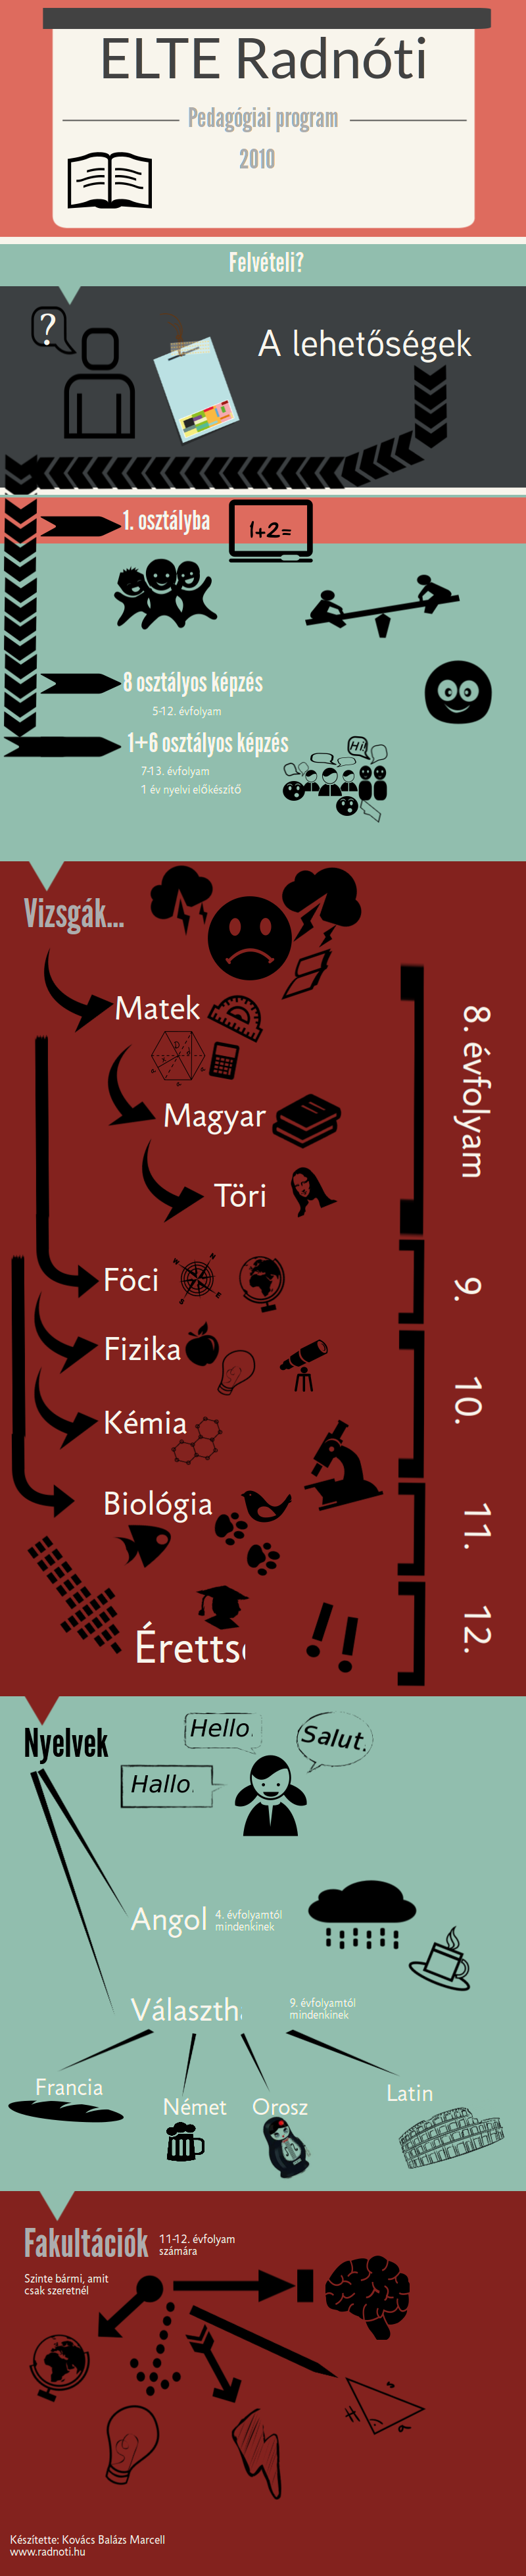
A legsikerültebb megoldást Fényes Balázs (i330FenyesBalazs.png) és Kovács Balázs Marcell (i330KovacsBalazsMarcell.png) küldte be. Mindketten a http://www.piktochart.com/ webes szerkesztővel dolgoztak.
Statistics:
5 students sent a solution. 10 points: Fényes Balázs, Kovács Balázs Marcell. 6 points: 1 student. 4 points: 1 student. 3 points: 1 student.
Problems in Information Technology of KöMaL, October 2013