 Problem I. 393. (January 2016)
I. 393. The program GeoGebra can effectively be used to visualize various mathematical concepts, function transformations, or geometric constructions, among others. One nice application is to animate trigonometric functions as projections of a rotating unit vector.
Create a GeoGebra worksheet to visualize the definition of the tangent function as follows.
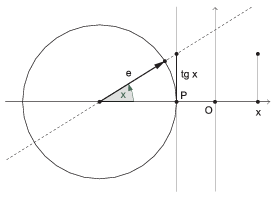
The sheet should contain a unit circle and the \(\displaystyle x\) axis of a coordinate system. The tangent of the angle appears as the length of the vertical segment touching the unit circle, see the figure. The unit vector \(\displaystyle \mathbf{e}\) should be rotated at a uniform speed, meanwhile there should be a smooth transition moving the vertical segment representing the tangent of the angle from the circle to the corresponding \(\displaystyle x\) value in the coordinate system.
During the animation, the graph of the tangent function should gradually appear in the coordinate system. The user should be able to control the sampling rate of the angle in the animation with a slider. The graph should contain at least the interval \(\displaystyle \left(-\pi/2, 3\pi/2\right)\).
The GeoGebra sheet with a brief documentation of your solution should be submitted in a compressed file i393.zip.
(10 pont)
Deadline expired on February 10, 2016.
Statistics:
6 students sent a solution. 10 points: Kovács 246 Benedek, Nagy Ábel, Olexó Gergely, Szakali Benedek, Szemerédi Levente. 9 points: Rittgasszer Ákos.
Problems in Information Technology of KöMaL, January 2016