KöMaL Problems in Informatics, May 2008
Please read the rules of the competition.
Show/hide problems of signs:
 |
Problems with sign 'I'Deadline expired on June 16, 2008. |
I. 187. Snowflakes agglomerate into larger heaps. Occasionally a slide occurs and an avalanche is formed. You should study this phenomenon - also typical for solid granular materials - by creating a simulation.
Let us consider a plane grid consisting of N×M cells (3 N,M100). A single snowflake is put randomly onto a cell in each simulation step. (Of course, in reality much more snowflakes fall at the same time, but this will be compensated by the large number of simulation steps.)
The thickness of the growing snow layer is computed for each cell. Nothing happens until a critical thickness HM (4HM12) is reached. If the thickness exceeds this value, the height of the snow in that cell decreases by 4: these 4 snowflakes roll over to each of the 4 neighbours of the cell, respectively. This increases the thickness of snow in the neighbouring cells as well, and if the critical level is reached there, the process continues in their neighbours and so on. (If the critical level is not reached, no further movement will occur and it is not necessary to examine further neighbours.) Snow falling through the border of the grid disappears. A slide occurs when snowflakes move through several cells, and if this region is large, an avalanche occurs.
Your graphical simulation should be updated after the fall of each snowflake. For visibility reasons, each cell is represented as a 3×3 or 5×5 block of pixels. Background colour should be used if there is no change in a cell, otherwise a different colour is used.
The left example illustrates a situation with 1 snowflake, and there is a slide in the right example.
It should be possible to run the simulation in a step-by-step mode (by pressing L or l) or in a continuous mode (F or f). The simulation should end if V or v is pressed.
The source code of your program (i187.pas, i187.cpp, ...) together with a short documentation (i187.txt, i187.pdf, ...) should be submitted, also containing a brief description of your solution and the name of the developer environment to use.
(10 pont)
solution (in Hungarian), statistics
I. 188. Aristid Lindenmayer (1925-1989) was a Hungarian-born biologist and mathematician living in the Netherlands. He modelled the growth of plants with algorithms and studied line fractals that can be described by textual formulae (``generative grammar''). We now call these L-systems and they can be considered as predecessors of turtle graphics (symbols encode the direction and motion of the pen).
In order to draw a fractal, we need to know an axiom, a rule and a turning angle. Complexity of figures depends on the number of recursive steps.
The Koch curve is a classical example of a line fractal.
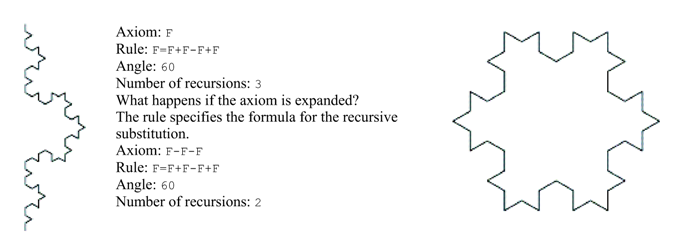
You should make the five L-system fractals on the given figures by using the Inkscape program (a freely downloadable vector-graphics editor). Use your imagination to create the sixth figure. (The function to generate an L-system is a bit hidden in the program: see Effects/Display/L-system.)
Possible axioms and rules in Inkscape:
|
The following example illustrates the usage of the stack when drawing a tree:
Axiom: F
Formula: F=F[+F][-F]
Angle: 25
Figures can be easily coloured by Inkscape.
The parameters to generate the given 5 figures (axiom, rule, angle and number of recursions) should be submitted together with a short documentation (i188.txt, i188.doc, ...), further one of your own figures and its parameter set (i188.svg, i188.png, ...).
(10 pont)
solution (in Hungarian), statistics
I. 189. The Goldbach conjecture says that every even number (greater than 2) can be expressed as a sum of two primes. Your task is to determine the number of ways an even integer not exceeding 100 can be represented as a sum a two primes. You should use a spreadsheet application: the number of possible sums of primes and a corresponding column chart should appear on sheet ``Goldbach''. Your solution should not use macros, only formulae and built-in functions.
Your sheet (i189.xls, i189.ods, ...) together with a short documentation (i189.txt, i189.pdf, ...) should be submitted containing a description of your solution and the name and version number of the spreadsheet application.
(10 pont)
 |
Problems with sign 'S'Deadline expired on June 16, 2008. |
S. 36. The railway network in a country has the following properties:
-there is only one track between two neighbouring stations, so a train can overtake another one only at the stations
-crossings only occur at the stations
-the network is connected, so it is possible to travel between any two cities by rail
-each train moves with the same constant speed everywhere.
After the structure of the network and current positions of the trains are given, your program should create a timetable: it should specify the route for each train to reach their destinations, and the travelling time for the last train to arrive is minimal.
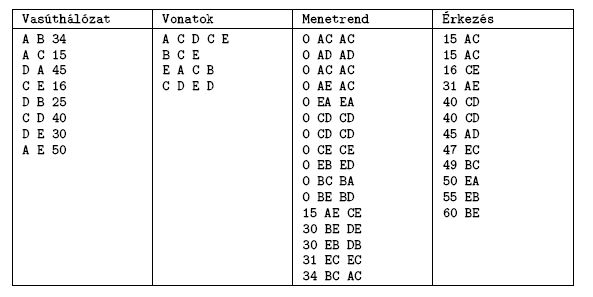
The railway network (Vasúthálózat in the figure) is given in a text file: each line contains the code letter of two cities and the travelling time between them, separated by spaces. There are at most 25 cities, denoted by capital letters of the English alphabet. Each travelling time is less than 100 minutes. Positions of trains (Vonatok in the figure) are also given in a text file: each line contains the letter of a city (the current position of certain trains), and each further letter denotes the destination of a train currently staying in that city. These letters are also separated by spaces.
Your program should specify for each city and train the departure times and routes. The timetable (Menetrend in the figure) should be written into a text file with each line containing the departure time in minutes (relative to the start of the simulation), the initial and destination cities of the train (two letters without a space), further the letters of the two cities (without a space) through which the train travels. The other output text file should contain the arrival time (Érkezés in the figure) of each train and letters of the initial and destination cities (without a space). Both output files should be sorted according to time instants and periods in increasing order. The four command line parameters of your program are the following: name of the input file describing the railway network, name of the input file describing the trains, finally the output files describing the timetable and arrival times.
The source code of your program (s36.pas, s36.cpp, ...) together with a short documentation (s36.txt, s36.pdf, ...) should be submitted, also containing a brief description of your solution and the name of the developer environment to use.
(10 pont)
$Var(Body)
Upload your solutions above