KöMaL Problems in Informatics, November 2009
Please read the rules of the competition.
Show/hide problems of signs:
 |
Problems with sign 'I'Deadline expired on December 13, 2009. |
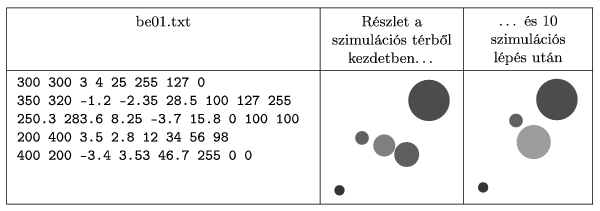
I. 223. Prepare a simulation to display the motion of coloured bubbles in the plane. Each bubble is represented by a disk of one-colour, bouncing on an 800×600 image and transforming into one another. Position and velocity of a bubble are given by real coordinate pairs, its radius is a real number, while its colour is a triplet of byte-sized integers in RGB encoding. Each bubble has also a certain mass, equal to the square of its radius, that is, proportional to its area. Bubbles move on the screen in every simulation step according to their velocity. If they leave the simulation area, they reappear on the opposite side with the same velocity, thus moving toward the interior part of the image. When two bubbles hit each other, they merge into one new bubble with
i) mass equal to the sum of the original masses, that is r12+r22;
ii) centre equal to the weighted mean of the centres of the original bubbles:
iii) coordinates of velocity given by the law of conservation of momentum
iv) R, G and B components of its colour again equal to the weighted mean of the original components (the weights being the masses).
If this newly created bubble touches a third one, yet another fusion takes place, governed by the same rules.
The first command line argument to your program is the name of a text file to be read. Each line of this file contains initial data for every bubble, separated by a space in the following format: position_x position_y velocity_x velocity_y radius red green blue.
In the example, ``be01.txt'' is the sample input, ``Részlet a szimulációs térből kezdetben'' is ``part of the simulation area in the beginning'', while ``és 10 szimulációs lépés után'' is ``after 10 simulation steps''.
The source code and project files of your solution -- without the i223.exe or any other auxiliary files generated by the compiler -- should be submitted in a compressed folder i223.zip.

(10 pont)
solution (in Hungarian), statistics
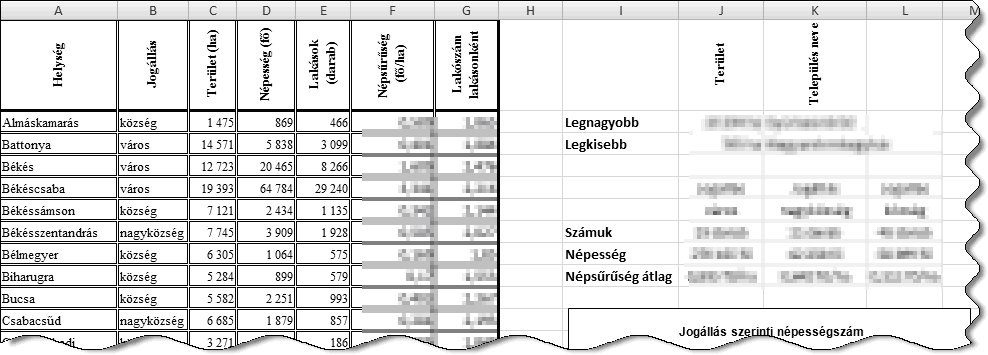
I. 224. The file bekesforr.txt (tabulator separated text file in UTF-8 encoding, downloadable from our web page) contains data of some settlements of Békés county in 2009.
1. Open the file bekesforr.txt in the spreadsheet application so that the first piece of data of that file appears in cell A1. Then save the data table with name i224 using the file format of your spreadsheet application.
2. Sort the data table into alphabetical order according to the settlements' name.
3. Create a header and legends in the appropriate cells according to the sample. Since texts in the first line are long, a 90 degree rotation and a line break are necessary, as in the example. Legends should be in boldface.
4. In cells F2:F76, the density of population of a settlement should appear, rounded to 3 digits. In cells G2:G76, the number of inhabitants in a typical home of each settlement should appear, computed in a similar way and rounded to 3 digits.
5. In cells C77:E77, determine the total area, population and number of homes of settlements in the county.
6. In cells J2:K3, the area and name of settlements of maximal and minimal area in the county should be visible.
7. By using the data of settlements, the following analysis should be performed:
a) In range J7:L7 the number of cities, towns and villages should appear.
b) In cells J8:L8, you should display the total number of inhabitants in Békés county, living in different types of settlements.
c) In range J9:L9, the average population density should be given with respect to different types of settlements.
d) Cells in J7:L9 should contain values in appropriate measurement units.

8. Draw a pie chart about the total number of inhabitants with respect to different types of settlements. The title of the chart should be ``Population statistics''. No legends should appear outside. Instead, the interior of sectors of the diagram should contain the type of settlement and the percentage of population living in that type of settlement.
9. The format of your sheet should follow that of the sample. Borders around the table and around the first and last rows should consist of thick lines. Other separating lines should appear as double lines. ``Thousands'' number separators should be used.
The spreadsheet (i224.xls, i224.ods, ...) together with a short documentation (i224.txt, i224.pdf, ...) also describing the name and version number of the spreadsheet application should be submitted.
(10 pont)
solution (in Hungarian), statistics
I. 225. In this task you will familiarize yourself with the awk programming language, a tool for processing text files quickly and efficiently.
The file match.txt contains results of some football matches, one match per each line: name of the home team, name of the visitor team, goals scored by the home team, goals scored by the visitors. (Pieces of data in the file are separated by single spaces.)
The following tasks should be solved in awk.
1. Create a list of matches by using the following format:\ Team Alpha -- Team Beta: 1--2 (In this exercise, all results should be displayed similarly.)
2. Create a list of matches played by Team Gamma.
3. Display matches when Team Delta won at home.
4. Give the number of matches in the file.
5. Display the largest difference in goals of all matches when visitors won.
6. Compute the total number of points scored by Team Alpha at home. (A win is 3 points, a draw is 1 point.)
7. Create a statistic showing how many times each result occurred. You can assume that no team scored more than 9 goals. (Results should be displayed from the viewpoint of the home team.)
1 point can be awarded for the correct solution of each of the first four tasks, while other tasks are worth 2 points each.
The following command for example displays the total number of goals during all matches
awk "BEGIN { ossz=0 }{ ossz+=($3+$4) } END { print ossz }" meccs.txt
The above command works under Windows; under Linux some modification of the limiting symbols may be necessary.
A description of awk (in Hungarian) can be found at http://hup.hu/old/gawk/tobb/gawk_toc.html.
Your file i225.txt should be submitted containing answers to the above questions (separated clearly in a readable format), moreover, the name of the operating system and the actual version number of awk.
(10 pont)
 |
Problems with sign 'S'Deadline expired on December 10, 2009. |
S. 48. You are given some tanks with known volume, initially all full of water, further, an unlimited water supply. In every step you can do one of the
- pour out the full content of a tank;
- completely refill a tank by using the unlimited water supply;
- pour some water out of a tank into another one, thus filling it up completely;
- pour some water out of a tank into another one, so that the first tank becomes empty (but the second one can not overflow).
Your program should determine whether it is possible -- and if possible, how -- to measure out exactly a prescribed amount of water by repeatedly applying the above rules. Data are read from the standard input, and the result is written to the standard output.
There are two integers (separated by a space) in the first line of the input: the number of tanks 2 N
N 4 and the amount of water 1
 V
V 30 to be measured out. Then each of the following N lines contains an integer: capacity of the ith tank, 1
 Ci
Ci 30, is found in the (i+1)th line.
If the prescribed amount of water can be measured out, then the output should be the minimal number of steps L; otherwise the output is ``-1''. If the amount of water can be measured out, the next L lines of the output should contain two integers (separated by a space): the first number is the number of the source tank, while the second number is that of the destination. If the first or second rule (of the four rules above) is applied, instead of a number, a ``*'' character should appear in the appropriate position. (Therefore, the ``*'' character represents a tank with infinite capacity.) If there is more than one solution, any of them can be given by your program.
In the table, ``Példa bemenet'' is the sample input, while ``kimenet'' is output.
The source code and project files of your solution-without the s48.exe or any other auxiliary files generated by the compiler-should be submitted together with a short documentation in a compressed folder s48.zip.
You may download the sample inputs and corresponding outputs from here.
(10 pont)
$Var(Body)
Upload your solutions above
