KöMaL Problems in Informatics, January 2011
Please read the rules of the competition.
Show/hide problems of signs:
 |
Problems with sign 'I'Deadline expired on February 10, 2011. |
I. 256. Many phenomena in nature involve some kind of pattern formation, typically driven by mechanisms in which various figures emerge from the initially uniform system. Spectacular examples include chemical waves (e.g. the famous Belousov--Zhabotinsky reaction), or animal coat pattern formation.

Your program i256 should simulate pattern formation by using the following model. Initially you take an M×M (10 M
M 500) grid with each cell having two possible colors. Colors are conveniently represented in a matrix. At the beginning of the simulation, each cell has a random color. In each of the following simulation steps you can change the color of a single random cell by the majority rule: the cell will take the color that is most common within its neighborhood. You should update the color of the cell directly on the screen without redrawing the complete grid in order to avoid flickering. Of course the shape of the resulting patches depends on the size of the neighborhood K (1
 K
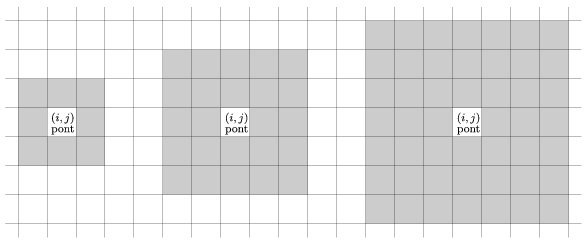
K 4) used in the majority rule. The example shows different neighborhood sizes for K=1,2 and 3. Boundary points have of course less neighboring cells. The simulation should run until the user stops it.
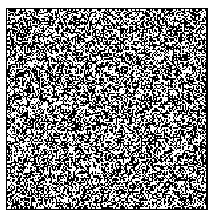
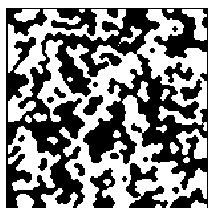
The command line arguments to your program are M and K. The second example shows a random initial grid together with a possible state after some simulation steps with M=150 and K=1.
 |  |
The source code (i256.pas, i256.cpp, ...) together with a short documentation (i256.txt, i256.pdf, ...) -- also describing which developer environment to use for compiling, further a brief description of your solution -- should be submitted.
(10 pont)
solution (in Hungarian), statistics
I. 257. The management of a certain store analyses shopping habits. Above the ground floor, the store has two floors and one staircase with two escalators, connecting the floors by going upstairs and downstairs. Surveillance cameras observe people entering and exiting the ground floor, and going upstairs and downstairs. Results are summarized quarter-hourly, from the morning opening until the evening closing, that is, between 8:00 and 20:00.
The text file szamlalas.txt (tabulator separated file in UTF-8 encoding, downloadable from our web page) contains the total number of customers in each quarter hour, collected by the six cameras. (In the example, ``0be'' and ``0ki'' abbreviate the number of customers entering and exiting the ground floor, ``1fel'' and ``1le'' stand for the number of people going up to the first floor and coming down from the first floor, ``2fel'' and ``2le'' denote similar numbers for the second floor.)
During your solution you should
-- use formulae, functions or links,
-- place auxiliary computations (if any) to the right of column R.
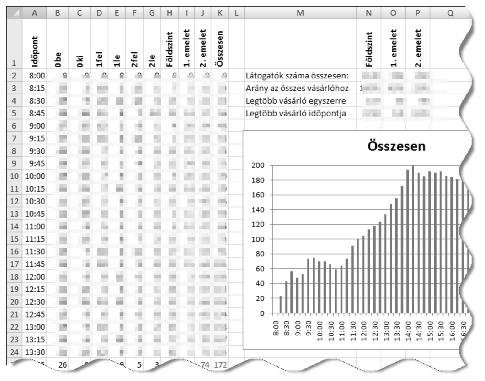
1. Open the file szamlalas.txt such that its first data piece is put into cell A1. The sheet should be saved as i257 in the default format of the spreadsheet application.
2. You should generate the appropriate time intervals from the opening until closing according to the example (see column ``Időpont'').
3. Cells in columns H, I, J and K should contain the number of customers at the end of the actual interval on each floor: column H for the ground floor (``Földszint'' in the example), I and J for the first and second floors (``1. emelet'', ``2. emelet'') and K for the complete store (``Összesen'').
4. According to the above data, you should answer the following questions.
a. Cells N2:P2 (``Látogatók száma összesen'') should contain the total number of customers that visited each floor during the whole day.b. Cells N3:P3 (``Arány az összes vásárlóhoz'') should contain the relative percentages on each floor (100% corresponds to the total number of customers in the store), using a cell format with zero decimal digits.
c. Cells N4:P4 (``Legtöbb vásárló egyszerre'') should count the maximum number of people present simultaneously on each floor.
d. Cells N5:P5 (``Legtöbb vásárló időpontja'') should display the time interval during which the most people were present simultaneously on each floor.
5. Computed values should appear in blue color.
6. Cells in the first row should be formatted according to the example. Appropriate column widths should be set so that all data is visible.
7. Create a bar chart on the sheet showing the total number of people in the store in each quarter hour, but
-- the chart should not have a legend,
-- its title should be ``Summary''
-- and every second quarter hour should be visible on the horizontal axis.
Your spreadsheet (i257.xls, i257.ods, ...) together with a short documentation (i257.txt, i257.pdf, ...) -- also describing the name and version number of the spreadsheet application -- should be submitted.
(10 pont)
solution (in Hungarian), statistics
I. 258. According to the ancient Greek geocentric model, Earth is the center of the universe, and the Moon, the Sun and the other planets orbit around it, while stars on the celestial sphere are fixed. They thought that the orbit of a moving celestial body could only be a perfect figure, in this case, a circle. However, in most cases they could observe that the motion of a planet relative to the fixed stars is not uniform, or even retrograde. To resolve this inconsistency, they though that their motion can be described by several circles instead of one: in the simplest case, the planet is assumed to move uniformly in a small circle (the epicycle), whose center in turn moves uniformly along a larger circle (the deferent, with its center being the Earth itself).
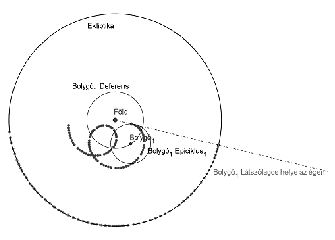
In our figure, ``Deferens'' is deferent, ``Epiciklus'' is epicycle, ``Bolygó'' is planet, ``Ekliptika'' is ecliptic and ``Látszólagos helye az égen'' is ``its apparent position in the sky''.
Since even this model was not a perfect one for some planets, they introduced several more epicycles: the center of a given epicycle moves along the previous epicycle, and so on, and the planet is on the outermost epicycle. The radius of the epicycles, moreover, the orbital periods of the epicycles are allowed to be different. With this system of epicycles they could correctly reproduce all observed planetary motions.
You should create an example similar to ours by GeoGebra (a freely downloadable software, http://www.geogebra.org), displaying the motion of 2 planets. Each planet should have 2 epicycles with modifiable radius by a slider. Additional sliders should correspond to the location of the centers, the orbital periods and the progress of time. The actual and visible motion of the two planets should be traced, but auxiliary points and lines should be hidden. You should use colors to highlight the important elements. You should also put appropriate legends so that one can easily understand your work.
Your GeoGebra solution i258.ggb should be submitted.
(10 pont)
 |
Problems with sign 'S'Deadline expired on February 10, 2011. |
S. 59. An investor plans to build a new luxury supermarket in the heart Manhattan. He knows that the building should be built as close to his future clients as possible. He already accurately surveyed the number of possible clients from each part of the city. Your task is to specify a location for the supermarket such that customers can reach it with the least travelling on the average.
Your program should solve this task. As usual, the map of Manhattan is considered as a regular grid with two-way streets, and crossings having integer coordinates.
For simplicity, we identify clients' flats and the supermarket with the corresponding nearest crossings. Instead of the Euclidean distance, we measure the distance between crossing with coordinates (xi,yi) and crossing
with coordinates (xj,yj) by the following formula (which is often termed as Manhattan distance):
, measuring the shortest distance along the grid.
The result of the investor's survey is read from the standard input: its first line contains the number of crossings , and the following N lines describe each crossing. There are three integers in the (i+1)st line separated by a space: the two coordinates
of the ith crossing and the number of expected clients 1
 wi
wi 1000 living there.
Your program should find the optimal crossing such that the average weighted distance between
and all the crossings listed above is minimal (with weights being the number of clients living on the actual crossing). In other words, the quantity
is to be minimized. The standard output should only contain three numbers separated by a space: the two coordinates x0, y0 of the optimal location and the average weighted distance
with 4 digits of precision. If there are many solutions, any of them can be given. In the example, ``Példa bemenet'' is a sample input, ``kimenet'' is output, while ``Térképvázlat'' is the corresponding map.
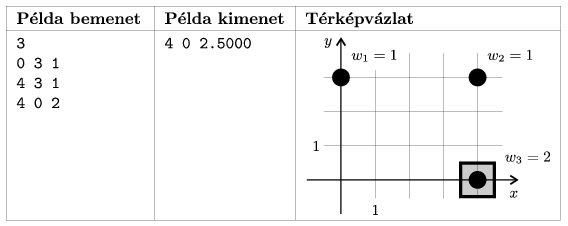
Evaluation: the maximal 8 points can be awarded if your program solves the largest test cases within one minute. 5 points can be awarded if your program correctly handles test cases already with N 1000. The documentation is worth 2 points.
The source code and project files of your solution -- without the .exe or any other auxiliary files generated by the compiler -- should be submitted together with a short documentation (s59.txt, s59.pdf, ...) in a compressed folder s59.zip.
(10 pont)
$Var(Body)
Upload your solutions above
