KöMaL Problems in Informatics, December 2011
Please read the rules of the competition.
Show/hide problems of signs:
 |
Problems with sign 'I'Deadline expired on January 10, 2012. |
I. 280. In exercise I. 271. a statistical model was proposed for percolation -- a phenomenon when a liquid passes through a solid but porous substance. The simulation was run on a grid of n×n squares (1 n
n 50), representing a vertical cross section of the solid material. The liquid can pass through each cell with probability p (0.00
 p
p 1.00), say, through a microscopic crack, and can not pass with probability 1-p. Now we extend our model with the assumption that the liquid can percolate in an arbitrary direction -- also vertically -- due to pressure. In the figure we see a percolation path through which liquid can pass.


The material in the figure allows percolation. There are 8 possible directions for the flow toward neighboring cells. By gradually increasing the probability p from 0, your program should determine the first state in which the liquid can percolate from top to bottom. The side length n of the grid can be an arbitrary value satisfying the constraints. The value of p should be increased in steps 0.05 until we find the desired state with complete percolation. For each p, it is sufficient to create a table. This state can be visualized in an arbitrary way, but cells allowing and not allowing percolation and the percolation path should be clearly visible.
The source code of your program (i280.pas, i280.cpp, ...), a brief documentation of your solution (i280.txt, i280.pdf, ...) and the name of the developer environment to use for compiling the source file should be submitted in a compressed file i280.zip.
(10 pont)
solution (in Hungarian), statistics
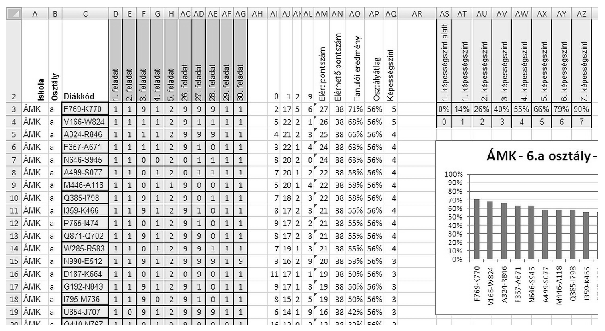
I. 281. The table below contains students' results from some classes of four secondary schools in a natural science knowledge survey. There were 30 test questions. Each is evaluated by 0, 1, 2 and 9. The meaning of 0, 1 and 2 is the corresponding point obtained for that question, whereas 9 was given if a student scored 0 points because of not working on that problem at all.

Create a spreadsheet i281, save it in the default file format of the application and evaluate the results according to the following (we hid some columns in the example so as to make the rightmost column also visible).
Auxiliary computations can be performed right to the below mentioned columns or below the data cells. If a value of a cell can not be computed, your program should replace it with suitable quantities, so the program will be able to solve further tasks depending on that result.
1. Open the text file term6_forras.txt (downloadable from our web page, in UTF-8 encoding) in a sheet Term6 beginning with cell A1. The first row of the sheet contains the maximal points for each exercise.
2. Insert the table header in the second row according to the example and hide the first row.
3. Write the evaluation codes in the second row of columns AI:AL. Rows below those should contain the number a particular student in that row got this mark in the header. These should be computed by functions, the formula in every column and row should be a copyable one.
4. Column AM should contain the total number of points of the student. The column header is ``Total points''.
5. Column AN should contain the maximal number of points that can be obtained by the students. The column header is ``Maximal points''.
6. The column header in column AO is ``Student's result'', below which results of each student should appear as an integer interpreted as percentages and computed from the previous two columns.
7. The column header in column AP is ``Class average''. The column contains his or her class average by using the same formula in that column.
8. Based on the results of the survey, each student is grouped into one of the 7 talent levels (``képességszint''), or into a 0th level (``1. képességszint alatt''). You should create a similar table in cells AS2:AZ4.

9. Based on the table and the performance of the student, column AQ should contain the talent levels as integers between 0 and 7 for each student, by using the same formula throughout the column. (``Talent level 3'' for example contains all students who scored at least 40%, but below 55%.) The column header should be ``Talent level''.
10. Sort the data according to the name of the school and class, and then into descending order according to student levels.
11. Create a bar chart similar to the example showing the data for the first class of the first school after the sorting. The title of the diagram should be the name of the school, then ``6.'', then the name of the corresponding class, and the date of the survey, that is 2011 May.
The spreadsheet (i281.xls, i281.ods, ...) together with a short documentation (i281.txt, i281.pdf, ...) also describing the name and version number of the spreadsheet application should be submitted in a compressed file i281.zip.
(10 pont)
solution (in Hungarian), statistics
I. 282. You can find many free (trial) Javascript solutions for displaying diagrams on web pages. Many of them contain a detailed help and documentation, so you can more easily build them into your programs. By using one of these, create a web page on which data can be entered and displayed graphically.
Data input should be done through the page urlap.html (``urlap'' means form). This should contain a 10×10 table of input cells. One should be able to write the data headers in the first row, the names of data series in the first column, and the diagram title (to be displayed later) into the first row of the first column. When using the form, the rest of the cells will contain integers. The data range of the table should be that part for which the header and data series names are non-empty. Empty cells in the data range selected this way should be given a 0 value. Below the table, radio buttons are present to choose from the possible diagram types: bar chart, pie chart or line diagram. In the final part, one should be able to select 1 out of the 5 possible color schemes, specifying the color of data points of the diagram to be created.
The bottom of urlap.html should contain a command button. When pressed, the page diagram.html should be loaded. This page should contain a diagram created from the data of the previous page. If the diagram type is a column or line diagram, then you should draw axes, the vertical axis should be properly scaled, and values of the data points should be displayed over them. If the diagram type is pie chart, then the data series names should be displayed together with the percentage of the given data point relative to the whole.
In a compressed file i282.zip you should submit the two HTML pages together with the necessary files for the operation, and a short documentation i282.txt containing the Javascript application's Internet address.
(10 pont)
 |
Problems with sign 'S'Deadline expired on January 10, 2012. |
S. 67. In the old times when computer networks mainly consisted of chains of computers connected by coaxial cables and BNC connectors, one of the favorite hobbies of the Evil SysAdmin was changing the network topology on the fly, then monitoring user reactions.
Newer and newer network building methods however rendered this amusement less joyful, so the Evil SysAdmin retried the hobby in a virtual environment. Your task is to develop a program component to simulate the state of the network and user reactions.
The simulation begins with an ``empty network'' consisting of N disconnected computers. It prompts for M network building and diagnostic operations. The goal is to determine whether each operation can be realized, and if yes, perform the network building operations.
The network building operations are detailed below:
-- add <A> <B>\ with 1 A
A B
B N being the number of the two computers, between which a new bidirectional connection should be established. The operation can be realized if at most 1 cable is connected to each of the computers, and the new connection does not result in a cycle.
-- remove <A> <B>\ with 1 A
A B
B N being the number of the two computers, between which the direct connection should be removed. The operation can be realized if there is a cable between A and B.
The following diagnostic operation determines whether there will be user reactions in the near future:
-- ping <A> <B>\ with 1 A
A B
B N being the number of the two computers, between which mutual accessibility is tested. The operation can be realized if there is a route between A and B.
You should give a ``yes'' or ``no'' answer depending on their realizability.
The inputs of your program and
are given through the first line of the standard input, separated by a space. The following M lines then describe an operation (one operation per line) in the above format.
The standard output should contain exactly M lines: each should contain the result of the corresponding operation. In order to obtain the maximal number of points, your program should give the proper answer in a few seconds even for the largest inputs.
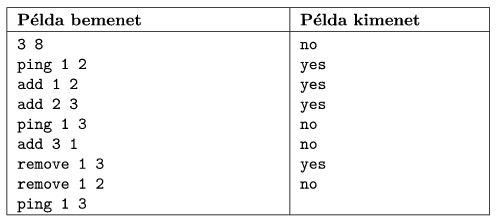
In the example, ``Példa bemenet'' is a sample input, while ``Példa kimenet'' is the corresponding output.

In a compressed folder s67.zip, the source code (s67.pas, s67.cpp, ...) of your solution -- without the .exe or any other auxiliary files generated by the compiler -- should be submitted together with a short documentation (s67.txt, s67.pdf, ...) also describing which developer environment to use for compiling.
(10 pont)
$Var(Body)
Upload your solutions above
