KöMaL Problems in Informatics, February 2013
Please read the rules of the competition.
Show/hide problems of signs:
 |
Problems with sign 'I'Deadline expired on March 11, 2013. |
I. 313. Tree rings (or annual rings) are formed in trees living in temperate zones due to the change of seasons. Tree growth is different during the winter and summer, and, for example, adequate moisture or a drought season can both affect the growth and hence the width of a ring, making it possible to study changes in the climate. Dendrochronology is a preferred method by archaeologists to date a particular event. If two trees in the same zone were born even at different times, but they were experiencing the same climate for some period in their lives, then the structure of their rings in that period is similar. By matching several such ring structures, archaeologists can obtain a very precise chronology even after thousands of years.
We are given the ring structure of N trees, that is, the width of their rings within a tolerance of one millimeter. (The techniques on how to make a cross section or how to evaluate these statistically are omitted now.) Since trees can be of different species or ages, when matching the samples, we compare the sequence of ratios of successive ring widths. For example, if the measured ring widths are 6, 4, 2, 8, 5 millimeters in a sample, then the corresponding sequence of ratios is 0.66, 0.50, 4.00, 0.62.
A match between 2 such sequences is considered acceptable, if there are at least 10 successive elements in both sequences such that the corresponding elements differ by at most 1%, moreover, the corresponding remaining elements (until the shorter sequence terminates) are the same. (Notice that you still have a certain freedom in the exact interpretation of this definition.) You should take into account that there can be an acceptable match between several sequences as well. (The input file will contain the ring structure of the oldest tree in its first row.)
Given N ring structure samples, your program i313 should display the maximal number of years (``Lefedett evek szama'' in the sample output) spanned by the appropriate ring structures forming an acceptable match and starting from the oldest tree. Your program should also display the order of these compatible samples (``Mintak sorrendje'' in the sample output).
The command line argument to your program is the name of the input file describing the ring structure data. The first line of this file contains the number of tree samples N (2 N50). Then each of the following N lines describes the ring structure of a particular tree: the first value in each row is H (10H500), giving the number of rings of the tree, then H integers follow, describing the width of each successive ring.
The table contains a sample input ``Példa a bemenetre'' and the corresponding output ``Kimenet a képernyőre''.
The source code (i313.pas, i313.cpp, ...) together with a short documentation (i313.txt, i313.pdf, ...) - also describing which developer environment to use for compiling, further a brief description of your solution - should be submitted.
(10 pont)
solution (in Hungarian), statistics
I. 314. There is a consensus among major science academies of the world that a leading cause of global warming is the increasing emission of greenhouse gases into the atmosphere. International organizations hence closely monitor such effects of the economy of different countries. A gas is called greenhouse gas, if it is more likely to absorb outgoing infrared radiation. The impact of such gases on the global warming is different, so in order to make a comparison between them, we use carbon dioxide equivalence: comparing the effects of the gas to the effects of 1 ton of CO2.
The most important greenhouse gases our civilization has been producing include: carbon dioxide (CO2), methane (CH4), nitrous oxide, a.k.a. laughing gas (N2O), fluorinated carbohydrates (CHF3, CH2FCF3, C2H3F3), perfluorocarbons (CF4, C2F6, C3F8, C6F14), sulfur hexafluoride (SF6), saturated chlorofluorocarbons or freons (CFCl3, CF2Cl2, CF2CFCl3), haloalkanes (CBrClF2, CBrF3) and unsaturated chlorofluorocarbons (CHF2Cl, CH3CF2Cl).
The Hungarian Central Statistical Office (KSH) regularly publishes the greenhouse gas emission of the EU countries based on a EuroStat database. This database is used for creating comprehensive analyses, and your task now will be to provide data for some investigations. Pieces of data in the database refer to the period between 1990 and 2010, and should be understood in 1000 tons of carbon dioxide equivalence units.
The UTF-8 encoded and tabulator separated text file, uveghaz.txt can be downloaded from our webpage, containing the data.
During your solution you should take into account the following.
- Use formulae, functions or references whenever possible.
- Auxiliary computations can be performed to the right of column AC, or below row 250.
1. The file uveghaz.txt should be opened in the spreadsheet application such that its first piece of data is put into cell A1. Then the sheet should be saved as i314 in the default format of the application.
2. Determine for each country and year the value of ``Egyéb kibocsátás'' (other types of emission) in rows 10, 18, and so on. These values can be determined from the ``Teljes kibocsátás'' (total emission) and the emission data of the various sectors displayed below that.
3. In columns X, Y and Z, you should determine for each data series the maximal, minimal and average emission values.
4. In column AA, you should determine for each data series the year in which the maximal emission occurred.
5. In cell B243, you should compute the number of countries in which the gas emission between 2000 and 2010 in the ``Hulladékgazdálkodás ágazat'' (waste management sector) decreased gradually (``Csökken'') from year to year.
6. In cell B244, you should determine the number of years during which the total emission produced by the three ``Mezőgazdaság'' (agricultural) sectors of the Benelux countries (i.e., Belgium, the Netherlands and Luxembourg) exceeded 9% of the combined emission of these three countries.
7. You should devise an expression in cell B247 which - based on the data in cells B245 (``év'' = year) and B246 (``ágazat'' = sector) - determines the number of countries producing more emission in that year and by that sector than the corresponding Hungarian sector that year (``Mo. helye'' = the rank of Hungary in the list). If any of the cells B245 or B246 is empty, cell B247 should remain empty.
8. Create a pie chart on a new sheet and display the emission data of each sector of the Hungarian economy in 2000. You should print the name of the sectors together with the corresponding percentages. The part of the chart corresponding to ``Egyéb'' (other types of emission) should be placed in front and highlighted, as in our example. The title of the diagram should be ``Greenhouse gas emitters of Hungary''.
9. Make similar changes in the format of your sheet as in the sample (merging cells, alignment, adding borders or thickening them).
Your spreadsheet (i314.xls, i314.ods, ...) together with a short documentation (i314.txt, i314.pdf, ...) - also describing the name and version number of the spreadsheet application - should be submitted.
The tables contain some samples.
Downloadable file:
(10 pont)
solution (in Hungarian), statistics
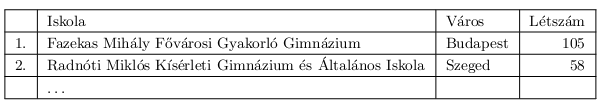
I. 315. Your task is to rank schools participating in the KoMaL contest. For each year, a separate list should be compiled and sorted according to the number of participating students from the schools. The link http://www.komal.hu/eredmeny/eredmeny.h.shtml?a=isklist&ev=2010 contains results of the school year 2010/2011, for example, but by modifying its last 4 characters, one can obtain data for the other years (= ``ev'') as well from 2001. The rankings should be displayed by using tables similar to the example (``Város'' is city and ``Létszám'' is the number of participating students).
Since this task would be quite time consuming if performed manually, you got some advice from an experienced IT colleague saying that a program in PHP language could easily solve the problem. Although control structures and some commands seemed familiar, your programming repertoire does not include PHP yet, so, as a sketch of the solution, you also got some useful keywords like strip_tags, explode, or associative array. To develop your program, the XAMPP multiplatform tool is recommended. In addition, the link www.php.net contains an extensive online documentation on PHP.
Summarizing, your task is to create a PHP program that displays the rankings, say, for the 2009/2010 school year in your browser at the address i315.php?ev=2009.
The source code of your program (i315.php) together with a short documentation (i315.txt, i315.pdf, ...) should be submitted, describing the main ideas of your solution and the actual PHP version used.
(10 pont)
 |
Problems with sign 'S'Deadline expired on March 11, 2013. |
S. 78. In a remote country scientists would like to investigate a new plant with very special needs.
They want to grow them on a connected field, that is, on adjacent parcels. They are given N consecutive parcels (), however, there are sometimes large differences in the parcel levels. The elevation of each parcel is determined by a positive integer ai (
) relative to the sea level. A further restriction is that the plant can be grown only on a group of parcels with the property that the elevation difference between any two parcels in the group is at most T
. Scientists want to maximize the number of parcels to grow the plant. Your task is to find this maximal number.
Your program should read the values of N and T from the first line of the standard input, then the integers ai each separated by a space from the next line. Your program should print the maximal parcel number in the only line of the standard output.
Example:
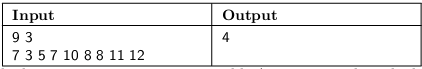
because parcels with elevation 7, 10, 8, 8 are acceptable (or even parcels with elevation 10, 8, 8, 11 would form a proper sequence of length 4), but no 5 adjacent parcels exist with the required properties.
Scoring and bounds. You can obtain 1 point for a brief and proper documentation clearly describing your solution. The maximal 9 points for your program can only be obtained if it can solve an arbitrary valid input within 2.5 seconds of running time. Since the input files may be huge, the reading operation alone may take 2 seconds for the largest test cases. Partial points can be obtained if your program can solve only smaller test cases within the allotted time, according to the following rules:
2 points for the interval
;
3 more points for
;
finally, 4 more points for the cases
.
The source code (s78.pas, s78.cpp, ...) without the .exe or any other auxiliary files generated by the compiler but with a short documentation (s78.txt, s78.pdf, ...) - also describing which developer environment to use for compiling - should be submitted in a compressed file s78.zip.
(10 pont)
$Var(Body)
Upload your solutions above