KöMaL Problems in Informatics, April 2015
Please read the rules of the competition.
Show/hide problems of signs:
 |
Problems with sign 'I'Deadline expired on May 11, 2015. |
I. 373. An effective way to format a text is to use styles: various attributes of text blocks can be set simultaneously with the corresponding styles, instead of setting the attributes one by one. In most applications, styles are not separate elements, but they can be given a tree structure. A particular attribute of a text block is determined by a value set locally. If a value is not given locally, then that attribute is determined by the one occurring in the corresponding style, or in the closest style above the actual style in the tree structure.
In this task we work with a simplified model of the above: text blocks are paragraphs, and attributes are positive integers. Create your program i373 to perform the following: for a given description of styles, it should produce another equivalent description, as compact as possible, then list the actual attributes for each text block.
The input file (``Bemenet'' in the example) consists of two parts. The first line of the first part is the number of the styles \(\displaystyle s\), then each of the following \(\displaystyle s\) lines describes a style. The first character (an uppercase letter of the English alphabet) is the style name, the next one is the style name just above the actual style in the tree structure (for the tree root, these first two characters are identical), then each attribute-value pair is given in the form of ``a lowercase English letter-positive integer''. Values are separated by exactly one space character. The second part of the input file first contains the number of paragraphs \(\displaystyle b\) (\(\displaystyle b\le 500\)) in the text. Then each of the following \(\displaystyle b\) lines describes a paragraph. The first character is the name of the applied style, then the locally valid attribute--value pairs are listed in a format similar to the one specified in the first part of the file.
The structure of the output file (``Kimenet'' in the example) is the same as the structure of the input file. The first part of the file contains the simplified style descriptions. In a simplified style description, a particular attribute should not appear if it does not modify the same attribute set in the styles above the actual one in the tree structure. The second part of the file contains a complete description of the actual attributes for each paragraph.

The first and second command line arguments to your program are the name of the input and output files, respectively.
The source code of your program (i373.pas, i373.cpp, ...) with a short documentation (i373.txt, i373.pdf, ...) - containing a brief description of your solution and specifying the developer environment to compile the source code - should be submitted as i373.zip.
(10 pont)
I. 374. A certain car manufacturing company has arrived in Hungary. They want to establish marketing offices and service centers in some Hungarian towns outside the capital, mostly in county towns or in some bigger towns in each county. The tabulator-separated and UTF-8 encoded text file motelep.csv contains the town names in the country, the \(\displaystyle X\) and \(\displaystyle Y\) coordinates (in meters) to locate the towns on the map, the name of the county of each town, and the name of the service center if such center will be established in that town. By using a spreadsheet application, you should solve the following tasks. You should save your solution i374 in the default application file format. You can also use the image momegyek.png containing a county map of Hungary. Both files can be downloaded from our webpage.
1. Open the file motelep.csv in a sheet starting from cell A1, then rename the sheet to városok (= towns). The sheet heading should contain the titles Város (= town), TérképX (= map X), TérképY (= map Y), Megye (= county) and Telephely (= service center), displayed in bold with gray background and horizontally aligned in the center.
2. Round the \(\displaystyle X\) and \(\displaystyle Y\) coordinates to integers, replace the original data with these, and use the new data in the following. Non-empty cells of the sheet should be bordered with a thin border. Data should be sorted according to county names, then, within each county, according to town names.
3. Create a diagram to display the towns in a sheet named városok diagram (= town diagram). Town locations should be represented by disks without their boundaries and filled with RGB \(\displaystyle (132,60,12)\) color.
4. The background image of the drawing area of the diagram should be the momegyek.png file. The diagram axes should be set such that no towns should appear outside the country, and settlements close to the capital Budapest should appear close to the capital boundary. The westernmost town Szentgotthárd, moreover, Balassagyarmat (located to the north of the capital) should be just on the boundary lines.
5. The diagram should have no legend. The diagram title ``Magyarország városai és megyéi'' should appear in the upper left corner, outside the country, having the same text color and with orange RGB \(\displaystyle (255,230,153)\) background color. Axes and grids should not be visible.
6. On a different sheet you should collect all the data corresponding to towns in which a service center will be established. The name of this new sheet should be telephely, and it should be formatted as the városok sheet. You should create a sheet telephely diagram having the same format as the previous diagram and containing the towns with service centers. The diagram title should be ``Magyarországi telephelyek'' (= Hungarian service centers).
7. Create a sheet távolságok (= distances) that gives the distance between an arbitrary town and a town with a service center. Distances are measured by using the map \(\displaystyle (X,Y)\) coordinates and the Pythagorean theorem. Starting from cell A2 downwards, all town names should appear by using a reference, and all town names with a service center should appear to the right of cell B1.
8. Distances between towns in the first column and towns in the first row should appear in the corresponding cell in the column-row intersection by using a formula that can be copied, having km as a distance unit, and using only integer values. Auxiliary cells for computations can be placed to the right of column CA or below row 350.
9. Create a sheet keresés (= search) to display service centers within a given distance from a given town. Cell A1 should contain the text ``Város'', cell A2 should contain the name of a Hungarian town, cell B1 should have the text ``Telephely'', and cell C1 should contain ``Távolság''. In cell B2 the closest town with a service center should appear, and cell C2 should contain their distances in km units. In this cell the numerical value should be followed by the text ``km''.
A short description of your solution (i374.pdf) containing the name and version of the spreadsheet application and your actual solution sheet (i374.xlsx, i374.ods, ...) should be submitted in a compressed file i374.zip.
Downloadable files: momegyek.png, motelep.csv.
(10 pont)
I. 375. In this task we study a mechanical model for the road junction problem by using a computer simulation.
The junction problem asks the following. We are given the location of three towns. Where to put the junction such that the total cost of roads to be built from the junction to the towns is minimal? A following mechanical model for this problem was given by Pólya György (see in his book George Pólya: Induction and Analogy in Mathematics, Princeton Univ. Press, 1954). We fix three pulleys with ropes, join one end of the ropes at a common point, and attach three equal weights on the other ends of the ropes. The equilibrium point of the system (where the forces acting at the common point cancel each other out) gives the location of the road junction.
You should generalize the above model to \(\displaystyle n\) points, and display the resulting system on the screen. To simplify the appearance, we replace each pulley with a hole cut in the plane that passes through the \(\displaystyle n\) points. Each rope is represented by a line segment joining the holes and the common point. The common point cannot be inside a hole. A model for \(\displaystyle n=3\) created by using the Wolfram Language is found at http://demonstrations.wolfram.com/PolyasMechanicalModelForTheFermatPoint/.
Your computer model should have the following properties.
\(\displaystyle \bullet\) The user should be able to set the value of \(\displaystyle n\) between 3 and 8;
\(\displaystyle \bullet\) The user should be able to specify the location of the holes in the plane, but a random hole configuration can also be chosen;
\(\displaystyle \bullet\) Your program approximates the equilibrium state iteratively according to the following rules:
\(\displaystyle a.\) the plane is viewed from above;
\(\displaystyle b.\) forces acting at the common point are represented by unit vectors along the direction of the ropes;
\(\displaystyle c.\) at the next iteration step the common point is moved to the direction determined by the sum of the unit vectors.
You can use any programming environment to solve the task. Your simulation should have a nice appearance and be easy to use.
A description of your solution (i375.pdf) containing the main steps and observations, the source code of your program, and any files necessary to compile or run the program should be submitted in a single compressed file (i375.zip).
(10 pont)
 |
Problems with sign 'S'Deadline expired on May 11, 2015. |
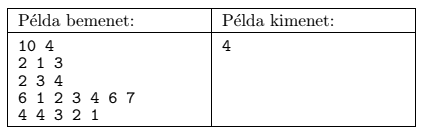
S. 98. We are upgrading our computer, so we have to buy some components, and replace the old ones with new. We want to minimize the total cost, hence we should buy the least number of new components. Each component has the same price. However, it can happen that certain \(\displaystyle k-1\) components out of a group of \(\displaystyle k\) components belonging together have to be replaced. In this case the \(\displaystyle k\)th component should also be replaced. The shop contains \(\displaystyle N\) types of components (\(\displaystyle 1\le N\le 1\;000\;000\), numbered from \(\displaystyle 1\) to \(\displaystyle N\)). A group of components belonging together can have an arbitrary size, but the total size of such groups is at most 250000. We also know that Component 1 should be replaced anyway.
Your program should read the values of \(\displaystyle N\) and \(\displaystyle C\) (the number of groups) from the first line of the standard input. Then, from each of the following \(\displaystyle C\) lines, it should read the number of components \(\displaystyle \mathrm{db}_i\) belonging to that group, finally the type of each component in that group as \(\displaystyle \mathrm{db}_i\) integers between \(\displaystyle 1\) and \(\displaystyle N\). It is possible that two groups have some common components. Your program should write the minimal number of new components to be bought in the first line of the standard output.
In the example, ``Példa bemenet'' is a sample input, while ``Példa kimenet'' is the corresponding output. In this situation we have to replace Components 1, 2, 3 and 4.
Scoring and bounds. You can obtain 1 point for a brief and proper documentation clearly describing your solution. Nine further points can be obtained provided that your program solves any arbitrary valid input within 1 second of running time.
The source code (s98.pas, s98.cpp, ...) without the .exe or any other auxiliary files generated by the compiler but with a short documentation (s98.txt, s98.pdf, ...), also describing which developer environment to use for compiling the source, should be submitted in a compressed file s98.zip.
(10 pont)
$Var(Body)
Upload your solutions above