KöMaL Problems in Informatics, April 2016
Please read the rules of the competition.
Show/hide problems of signs:
 |
Problems with sign 'I'Deadline expired on May 10, 2016. |
I. 400. There are \(\displaystyle K\) (\(\displaystyle 0\le K\le 1\,000\)) possibly different rectangles scattered on an \(\displaystyle N\times M\) (\(\displaystyle 10\le N,M\le 10\,000\)) grid. The sides of the rectangles are parallel to the grid sides; the rectangles can touch one another or overlap, but they cannot extend beyond the grid boundary.
Create your program i400 to solve the following tasks.
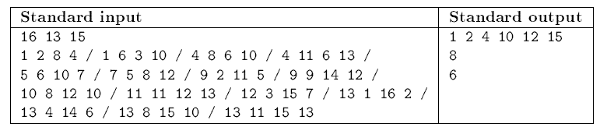
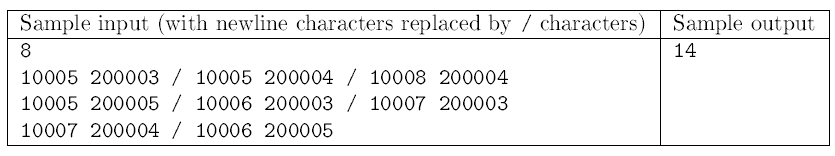
Your program should read the values of \(\displaystyle N\), \(\displaystyle M\) and \(\displaystyle K\) from the first line of the standard input. The following \(\displaystyle K\) lines contain the \(\displaystyle X\) and \(\displaystyle Y\) (integer) coordinates of the upper left and lower right corners of the rectangles.
Each line of the standard output should contain the answer to the following questions.
– List the rectangle numbers (in the original order) that touch the grid boundary.
– Determine the rectangle that contains the maximum number of some corners of other rectangles. Rectangles that are just touched should be ignored. If there are more solutions, it is sufficient to give only one.
– Determine the number of independent rectangles. A rectangle is independent if it does not touch, intersect or contain any other rectangles, and it is not contained in any rectangle.
Example (with some newline characters replaced by / for brevity):
The source code and a short documentation of your program—containing a brief description of your solution, and the name of the developer environment to compile your code—should be submitted in a compressed file i400.zip.
(10 pont)
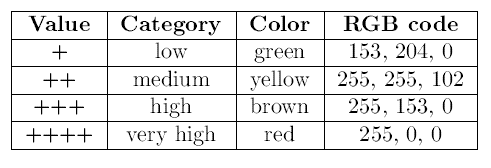
I. 401. (É). Besides weather forecast, meteorological offices often monitor pollen levels. A pollen report contains a 4-level scale of + symbols describing the danger level for the most important allergens or fungal spores. The allergenicity, that is, the frequency of symptoms, is also measured by using the same 4-level scale of + symbols.
The file meres.txt (downloadable from our website) contains the average pollen levels of a given week. In your solution try and use formulae and references; auxiliary computations should be performed on a different sheet, and do not use user-defined functions or macros.
1. Open the tab-separated and UTF-8-encoded data file meres.txt in the spreadsheet application such that the first data piece appears in cell A1. Rename the sheet to Mérés, then save it with name i401 in the default file format of the application.
2. The structure of the table and the cell format should be adjusted according to the description and example.
\(\displaystyle a)\) Use 7- and 10-point Arial fonts on the sheet.
\(\displaystyle b)\) Cells should be aligned according to the example.
\(\displaystyle c)\) The background of the data cells should depend on the danger level, that is, on the number of + symbols.
\(\displaystyle d)\) In the data cell range, inner cells should be bordered by single thin lines, and the outermost cells by a double cell border.
3. Below the data cells, display for each city the weekly pollen levels of the various allergens by using stacked column charts. The diagram title and structure should be based on the example.
4. Create a new sheet Információ according to the sample. Cell texts, with the exception of the second row, should be typed as in the example.
5. By using a function in the third and fourth cells, determine the allergenicity and the symptoms based on the city name and allergen name in the first two cells of the second row, and on the actual values of the sheet Mérés.
6. The sheet format should be set according to the example.
\(\displaystyle a)\) The font size and style should follow those on the sheet Mérés.
\(\displaystyle b)\) Also copy the cell grouping and alignment.
\(\displaystyle c)\) The first two cells of the second row should have a gray background, and the third and fourth cells should contain boldface fonts.
\(\displaystyle d)\) The cell background colors of the table of danger levels should follow the colors given for the sheet Mérés.
The sheet containing your solution and its short documentation should be submitted in a compressed file i401.zip.
Downloadable file: meres.txt
(10 pont)
I. 402. We regularly collect data in XML file format. To help generate well-formed and valid XML files, we include a sample XML file and an XML Schema file (XSD). The validity of the XML file can be verified with the XSD file. An online verification tool is found at http://www.utilities-online.info/xsdvalidation/.
This time however we accidentally deleted the XSD file and we only have the valid XML sample. Your program should reconstruct the XSD file as accurately as possible. For each element you should provide the name, type and—if necessary—the number of occurrences.
Data in the available XML file have at most 4 levels of nesting (this includes the root element). We know that complex types include only sequences, while elementary types include only the following: xs:integer, xs:decimal (for example, 12.34), xs:date (with format yyyy-mm-dd, for example, 2014-01-01) or xs:time (with format hh:mm:ss, for example, 10:30:00). Unrecognized types should be classified as xs:string. If an element appears multiple times, the maximum number of occurrences should be set to infinity; if there is a missing element, the minimum number of occurrences should be set to zero.
You will find some relevant information about this topic on the following pages (but it may be worth looking for some more sources):
- http://www.inf.unideb.hu/~bodai/31-xml_alk/xmlSchemas.html;
- http://soci.hu/articles/xml/XmlSema.pdf.
The input file is a well-formed XML file. The characters <, >, and / are only found in tags in the file. The output file should be an XSD file which displays a ``valid'' message for the XML file when using the form on the web page given in the first paragraph of this exercise. (The sample files can be downloaded from our web page.)
The first command-line argument of your program is the name of the input file, and the second argument is the name of the output file.
The source code and a short documentation of your program—containing a brief description of your solution, and the name of the developer environment to compile your code—should be submitted in a compressed file i402.zip.
Downloadable files: zenekar.xml, zenekar.xsd
(10 pont)
 |
Problems with sign 'I/S'Deadline expired on May 10, 2016. |
I/S. 8. An ant executes the following commands: F (one step forward), L (left turn by 90 degrees), and R (right turn by 90 degrees). The ant receives \(\displaystyle N\) (\(\displaystyle 1\le N\le 100\,000\)) commands, and starts its path from the coordinate \(\displaystyle (0;0)\). You should figure out the number of possible final positions of the ant, if exactly one command, out of the \(\displaystyle N\) commands, is replaced by a different one (for example, instead of L at a certain point, it performs an F).
Your program should read the list of commands from the first line of the standard input. The first and only line of the standard output should contain the total number of final positions.
| Sample input | Sample output |
| FF | 3 |
Explanation. By changing exactly one command, we obtain FL, FR, RF or LF, corresponding to the final positions \(\displaystyle (0;1)\), \(\displaystyle (0;1)\), \(\displaystyle (1;0)\) and \(\displaystyle (-1;0)\).
Scoring and bounds. You can get 1 point for a brief and proper documentation clearly describing your solution. Nine further points can be obtained provided that your program solves any valid input within 1 second of running time.
The source code of your program with a short documentation—also describing which developer environment to use for compiling the source—should be submitted in a compressed file is8.zip.
(10 pont)
 |
Problems with sign 'S'Deadline expired on May 10, 2016. |
S. 107. There are \(\displaystyle N\) (\(\displaystyle 1\le N\le 200\,000\)) trees on a huge grid (\(\displaystyle 10\,000\,000\times 10\,000\,000\)) with each tree occupying one square. A squirrel notices that it can reach any tree starting from an arbitrary tree by a series of jumps from a tree to an adjacent tree (two squares are adjacent if they share a common edge). Although the set of squares containing the trees form a connected region, this region may contain holes (i.e., empty squares). Determine the length of the outer boundary of the forest (that is, without the holes).
Your program should read the value of \(\displaystyle N\) from the first line of the standard input, then the tree coordinates (\(\displaystyle 1\le x, y\le 10\,000\,000\)) from the next \(\displaystyle N\) lines. The first and only line of the standard output should contain the length of the outer boundary.
Scoring and bounds. You can get 1 point for a brief and proper documentation clearly describing your solution. Nine further points can be obtained provided that your program solves any valid input within 1 second of running time.
The source code of your program with a short documentation—also describing which developer environment to use for compiling the source—should be submitted in a compressed file s107.zip.
(10 pont)
$Var(Body)
Upload your solutions above