KöMaL Problems in Informatics, January 2013
Please read the rules of the competition.
Show/hide problems of signs:
 |
Problems with sign 'I'Deadline expired on February 11, 2013. |
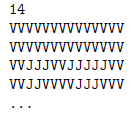
I. 310. In this task you are going to model floating ice floes. The corresponding data file jegesviz.txt can be downloaded from our website. The file contains an N×N grid with cells filled with ``V'' (=water) or ``J'' (=ice). All border cells contain water.
The first line of the file jegesviz.txt contains an integer (3 N100), describing the number of rows (or columns) of the table. Then each of the following N lines contains N characters (either ``V'' or ``J'').
The first few lines of the file jegesviz.txt are displayed in the table.
Your program i310 should solve the following tasks. First, the number of the actual task (e.g. ,,Task #2'') should be displayed. Diacritical marks in the output may be omitted.
1. Read and store the data from jegesviz.txt.
2. By using the data from the file, compute and display (to 2 decimals) how many percent of the area is covered with ice.
3. Display which edge of the table is the closest one to the ice floes. If the answer is not unique, it is enough to give one of them. For example: The bottom edge is the closest one to the ice floes.
4. Nearby cells containing a ``J'' form an ice floe: a floe may consist of one or more ``J'' cells. If a floe has more than one ``J'', then at least one of the 4 neighbors of each ``J'' cell should also contain a ``J''. Display the number of ice floes.
5. Determine and display the number of ``J'' cells that are part of the largest ice floe.
6. Ice floes are melting in every time unit near their boundaries. A ``J'' cell is converted to a ``V'' cell, if at least 2 of its 4 side neighbors are already ``V'' cells. Display the number of time units after which there are no more floes present.
The source code (i310.pas, i310.cpp, ...) together with a short documentation (i310.txt, i310.pdf, ...) - also describing which developer environment to use for compiling, further a brief description of your solution - should be submitted.
Input example: jegesviz.txt
(10 pont)
solution (in Hungarian), statistics
I. 311. Concrete paver blocks are laid by a machine in a park. The park is rectangle-shaped and the blocks are squares of unit side length. The machine can move forward, backward, right or left, by one unit, in each step. In each step a block is laid. During the construction, the path may cross itself. In this case, blocks are placed on top of one another. These extra blocks should be collected and removed later.
The path of the machine is described in advance in a file as a coordinate sequence of horizontal and vertical units. Each line of the file (3N100) contains the actual x and y coordinates of the machine. The machine can start from any grid point of the park and it can lay at most 200 blocks in one run.
By using a spreadsheet application, you should solve the following tasks. The solution should not use any macros or own functions.
1. Beginning with cell A1, import the UTF-8 encoded, tabulator separated text file utterv.txt (downloadable from our site), and save the sheet as i311 in the default format of the spreadsheet application.
2. By inserting rows and columns, and filling up cells, create a header similar to the sample.
3. The path of the machine and the laid blocks should also be displayed by using characters. To achieve this, first you should adjust the corresponding column widths and row heights such that cells to be displayed appear as squares. Then, row and column coordinates should be shown in bold face.
4. By using a copyable formula, you should determine the number of blocks placed on top of one another at each point of the park after the program of the machine has been executed. You may create auxiliary computations in any column, but these should not be hidden.
5. By using conditional formatting and coloring the cells, you should highlight the path of the machine. You should rename the sheet to Terkep (``map'').
6. Create a new sheet Elemzes (``analysis''). The following tasks should be answered in this sheet. Auxiliary computations are allowed in any column, and, similarly as before, these should also remain visible.
7. Compute how many percent of the area of the park is not covered with blocks.
8. What is the maximal number of blocks put on top of one another? What are the coordinates of this square? (If the answer is not unique, you can freely choose one to give.)
9. For each of the 4 edges of the park, determine the coordinates of the block which is located the closest to the actual edge. (If there are more blocks with the smallest distance, it is sufficient to give one of them.)
10. How many blocks should be removed finally such that no overlaps remain?
11. If the above extra blocks can be removed and transferred to the square with coordinates (0,0) located outside the park only one by one, then what is the total path length covered during this operation? (We assume now that, when carrying a block, only steps to the left and up are allowed.)
Your spreadsheet (i311.xls, i311.ods, ...) together with a short documentation (i311.txt, i311.pdf, ...) - also describing the name and version number of the spreadsheet application - should be submitted.
Downloadable file: utterv.txt
(10 pont)
solution (in Hungarian), statistics
I. 312. More and more web pages feature images similar to this one (see the figure).

The image represents the tag cloud (or word cloud) of the topics of the oral part of an advanced exam in informatics in Hungary. According to the English Wikipedia, ``a tag cloud ...is a visual representation for text data, typically used to depict keyword metadata (tags) on websites, or to visualize free form text. Tags are usually single words, and the importance of each tag is shown with font size or color. This format is useful for quickly perceiving the most prominent terms and for locating a term alphabetically to determine its relative prominence.''
Your task now is to collect several tools or programs suitable to generate tag clouds. By selecting one of them, you should analyze some text samples: by considering the corresponding tag clouds, you should compare
the text of all poems of a famous poet written in a specific year with all the other poems written in a different year;
two novels of a writer;
two scientific works on the same topic.
Then, you should select a different tool from your list, and analyze one of the novels with this tool as well.
You should create a presentation visualizing your findings and summarizing your conclusions.
Your presentation (i312.ppt, i312.odp, ...) together with a documentation (i312.pdf) of the analysis should be submitted, also containing the name and location of the tools you have found.
(10 pont)
 |
Problems with sign 'S'Deadline expired on February 11, 2013. |
S. 77. Your robot has to navigate through an obstacle course: the goal is to reach the x-axis as soon as possible. However, there are several obstacles on the board, represented as horizontal line segments (without having any thickness in the y-direction) blocking the robot's way: the robot cannot pass through these. The movement of the robot is always parallel to the axes.
Your program should determine the length of the shortest path of the robot reaching the x-axis, provided that the initial position of the robot and the positions of the endpoints of the obstacles are known.
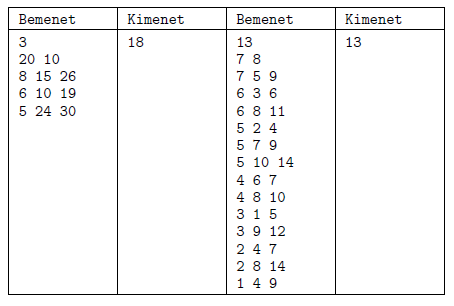
Input: The first line of the standard input contains the number of obstacles (), while the second line contains the x and y coordinates of the initial position of the robot, separated by a space. Then each of the following N lines describes an obstacle by 3 numbers (separated by a space): the first giving the y coordinate of the actual line segment, while the next two numbers specifying the x coordinates of its endpoints. All coordinates are positive integers below 1000000. Obstacles are disjoint and their length cannot be 0.
Output: The single line of the standard output should contain the length of the shortest path.
In the examples below (``Példák''), some input-output (``Bemenet-Kimenet'') pairs are shown.
Scoring: You can obtain 2 points for a brief and proper documentation clearly describing your solution. The maximal 8 points for your program can only be obtained if it can solve an arbitrary valid input within 3 seconds of running time. Partial points can be obtained if your program can solve only smaller test cases (for example, when the coordinates are between 0 and 100) within the allotted time.
The source code (s77.pas, s77.cpp, ...) without the .exe or any other auxiliary files generated by the compiler but with a short documentation (s77.txt, s77.pdf, ...) - also describing which developer environment to use for compiling - should be submitted in a compressed file s77.zip.
Based on the idea of Gábor Gyebnár
(10 pont)
$Var(Body)
Upload your solutions above