KöMaL Problems in Informatics, January 2016
Please read the rules of the competition.
Show/hide problems of signs:
 |
Problems with sign 'I'Deadline expired on February 10, 2016. |
I. 391. The Cucumber Domestication Institute celebrates its \(\displaystyle 10^{\textrm{th}}\) anniversary so they carefully measured and recorded the heights of their nice cucumber trees located on the two sides of a pathway.
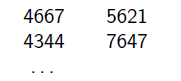
The cucumber tree heights in centimeters are found in the UTF-8 encoded and tabulator-separated text file fak.txt (downloadable from our site). Each line contains two tree heights (the numbering starts from 1), the heights of the left and right trees, respectively. In the example, the height of the tree 1B (first row, left side) is 4667 cm, while that of the tree 2J (second row, right side) is 7647 cm.
Your program i391 should solve the following tasks. When displaying data on the screen, you should also display the task number.
1. Read the cucumber tree data from the file, and display the number of trees on both sides of the pathway using the layout in the example.
2. What is the average tree height? How many trees are there on the left and on the right sides that are higher than the average? You should use the same layout as in the example, and use two decimal digits.
3. Any of the highest trees is called the pride of the institute. Find all of them and display their coordinates according to the example.
4. A tree is called the disgrace of the institute if it has two neighbors and it is smaller than any of those. The Institute will pay more attention to these trees in the future. According to the sample, display the coordinates of the highest tree(s) being the disgrace of the institute.
5. During the celebrations the 10 highest trees will play a prominent role. Display the coordinates of these according to the sample. You should display data corresponding to exactly 10 trees even if there is a "tie".
Ubul, the little monkey of the Institute, likes hopping on the treetops. Ubul always starts from the first tree of the left side, and either hops onto a tree on the same side or jumps onto a tree on the other side having the same row number. Ubul never returns to its earlier position.
6. On one occasion, Ubul always chooses the higher tree out of the two possibilities to jump on. (If both trees have the same height, Ubul stays on the same side.) The first line of the file ubul.txt should contain the tree names (separated by a space) visited by Ubul in order.
7. On another occasion, Ubul's path contains monotonically increasing trees until it is impossible to continue this way. If the path no longer leads upward, Ubul changes direction and jump monotonically down as long as it is possible. Then changes direction again, and so on. If both possible target trees are higher (or both smaller, or both have the same height), then Ubul stays on the same side. The second line of the file ubul.txt should contain Ubul's path (separated by spaces). The third line of the file should contain the total elevation and depression of Ubul in cm during its path.
The source code and a short documentation of your program—containing a brief description of your solution, and the name of the developer environment to compile your code—should be submitted in a compressed file i391.zip.
Sample:
Downloadable file: fak.txt
(10 pont)
I. 392. The file talalmanyok.txt (downloadable from our web page) contains data about some Hungarian inventions and inventors. The file is an UTF-8 encoded and tabulator-separated text file, and it does not contain field names.
Columns of the table have the following meaning:
| \(\displaystyle 1^{st}\) column | Family and given names of the inventor or researcher. |
| \(\displaystyle 2^{nd}\) column | Year of birth of the researcher. |
| \(\displaystyle 3^{rd}\) column | Year of death—empty if currently alive. |
| \(\displaystyle 4^{th}\) column | The name of the invention. |
Design and complete a relational database i392 containing the data for inventors and inventions.
– When designing the structure of the database and tables, you should take into account that many inventors have more than one invention, and one invention could be created by more than one inventor.
– Data in the source file should be organized logically into several tables, together with setting up the appropriate field names and types.
– Keys should be created in the tables, and you should design the connections between the individuals.
– By using a Boolean value, the source data should be expanded by a new field specifying whether the invention can be considered as a novelty in the field of electricity/electronics. (In the case of the transformer for example, this Boolean value is true. But for a nuclear power plant, the field value is false, since its essential novelty is not directly related to electricity.) This new field value should be set for each record.
You should also solve the following tasks. Queries should be saved by using the names given in parentheses.
List the inventor(s) who
1. had more than 5 inventions (1otneltobb);
2. created their inventions on their own without any collaborators (2egyedul);
3. had inventions related to electronics and also some other inventions not related to this field (3tobb);
4. had joint inventions with Kálmán Kandó. List both the inventors and the inventions. (4kando);
5. has their family name appearing in the name of the invention. The inventor's full name and the name of the invention should be displayed. (5nevado).
List the inventions
6. that were created by the same inventor who invented radial engine (6csillag);
7. that were invented by the oldest inventor appearing in our database (7régi);
8. whose inventor does not appear in the database, because the inventor is unknown or the invention has too many inventors (8nevtelen).
Your database (i392.odb, i392.accdb, i392.sql) and data tables in tabulator-separated text files should be submitted as a compressed file i392.zip.
(10 pont)
I. 393. The program GeoGebra can effectively be used to visualize various mathematical concepts, function transformations, or geometric constructions, among others. One nice application is to animate trigonometric functions as projections of a rotating unit vector.
Create a GeoGebra worksheet to visualize the definition of the tangent function as follows.
The sheet should contain a unit circle and the \(\displaystyle x\) axis of a coordinate system. The tangent of the angle appears as the length of the vertical segment touching the unit circle, see the figure. The unit vector \(\displaystyle \mathbf{e}\) should be rotated at a uniform speed, meanwhile there should be a smooth transition moving the vertical segment representing the tangent of the angle from the circle to the corresponding \(\displaystyle x\) value in the coordinate system.
During the animation, the graph of the tangent function should gradually appear in the coordinate system. The user should be able to control the sampling rate of the angle in the animation with a slider. The graph should contain at least the interval \(\displaystyle \left(-\pi/2, 3\pi/2\right)\).
The GeoGebra sheet with a brief documentation of your solution should be submitted in a compressed file i393.zip.
(10 pont)
 |
Problems with sign 'I/S'Deadline expired on February 10, 2016. |
I/S. 5. We are given \(\displaystyle N\) initially empty boxes (\(\displaystyle 1 \le N \le 1\;000\;000\), \(\displaystyle N\) is an odd integer). We repeat the following procedure: in a single step we put some stones into certain neighboring boxes (each neighboring box will have one new stone). We will perform \(\displaystyle K\) steps (\(\displaystyle 1\le K \le 25\;000\)), and each step is described by two numbers \(\displaystyle x\), \(\displaystyle y\) (\(\displaystyle x\le y\)), meaning that in the actual step we put a stone into each box between the \(\displaystyle x^\mathrm{th}\) and \(\displaystyle y^\mathrm{th}\) boxes. We are then interested in the median of the number of stones in the \(\displaystyle N\) boxes. The median of a sequence having an odd number of terms is the center element in the sorted version of the sequence.
Your program should read the values of \(\displaystyle N\) and \(\displaystyle K\) from the first line of the standard input, then the pairs \(\displaystyle x\), \(\displaystyle y\) from the next \(\displaystyle K\) lines. The first and only line of the standard output should contain the median at the final state.
| Sample input (here / means new line): | Sample output: |
| 7 4 / 5 5 / 2 4 / 4 6 / 3 5 | 1 |
In this example the number of stones in the boxes at the final state in increasing order is 0, 0, 1, 1, 2, 3, 3, hence the median is 1.
Scoring and bounds. You can get 1 point for a brief and proper documentation clearly describing your solution. Nine further points can be obtained provided that your program solves any valid input within 1 second of running time.
The source code of your program with a short documentation—also describing which developer environment to use for compiling the source—should be submitted in a compressed file is5.zip.
(10 pont)
 |
Problems with sign 'S'Deadline expired on February 10, 2016. |
S. 104. In the ternary numeral system there are just three digits: 0, 1 and 2. People using this system love beautiful numbers. There are \(\displaystyle N\le 20\) basic beautiful numbers. To measure the beauty of a given number, they count how many basic beautiful numbers it contains. Suppose for example that \(\displaystyle N = 3\) and the three basic beautiful numbers are 010, 21 and 01021. Then the beauty factor of the number 01021 is 3, since this number contains 010, 21 and 01021 as substrings. We know that any basic beautiful number has at most 15 digits. If a number contains a given basic beautiful number several times, then each occurrence increases the beauty factor of that number by one. We would like to find the largest beauty factor among all numbers with \(\displaystyle K\le 1000\) digits.
Your program should read the values of \(\displaystyle N\) and \(\displaystyle K\) from the first line of the standard input, then the basic beautiful numbers \(\displaystyle a_i\) from the next \(\displaystyle N\) lines. The first and only line of the standard output should contain the largest beauty factor.
| Példa bemenet (Sample input (here / means new line): | Sample output: |
| 3 7 / 010 / 21 / 01021 | 4 |
Scoring and bounds. You can get 1 point for a brief and proper documentation clearly describing your solution. Nine further points can be obtained provided that your program solves any valid input within 1 second of running time.
The source code of your program with a short documentation—also describing which developer environment to use for compiling the source—should be submitted in a compressed file s104.zip.
(10 pont)
$Var(Body)
Upload your solutions above